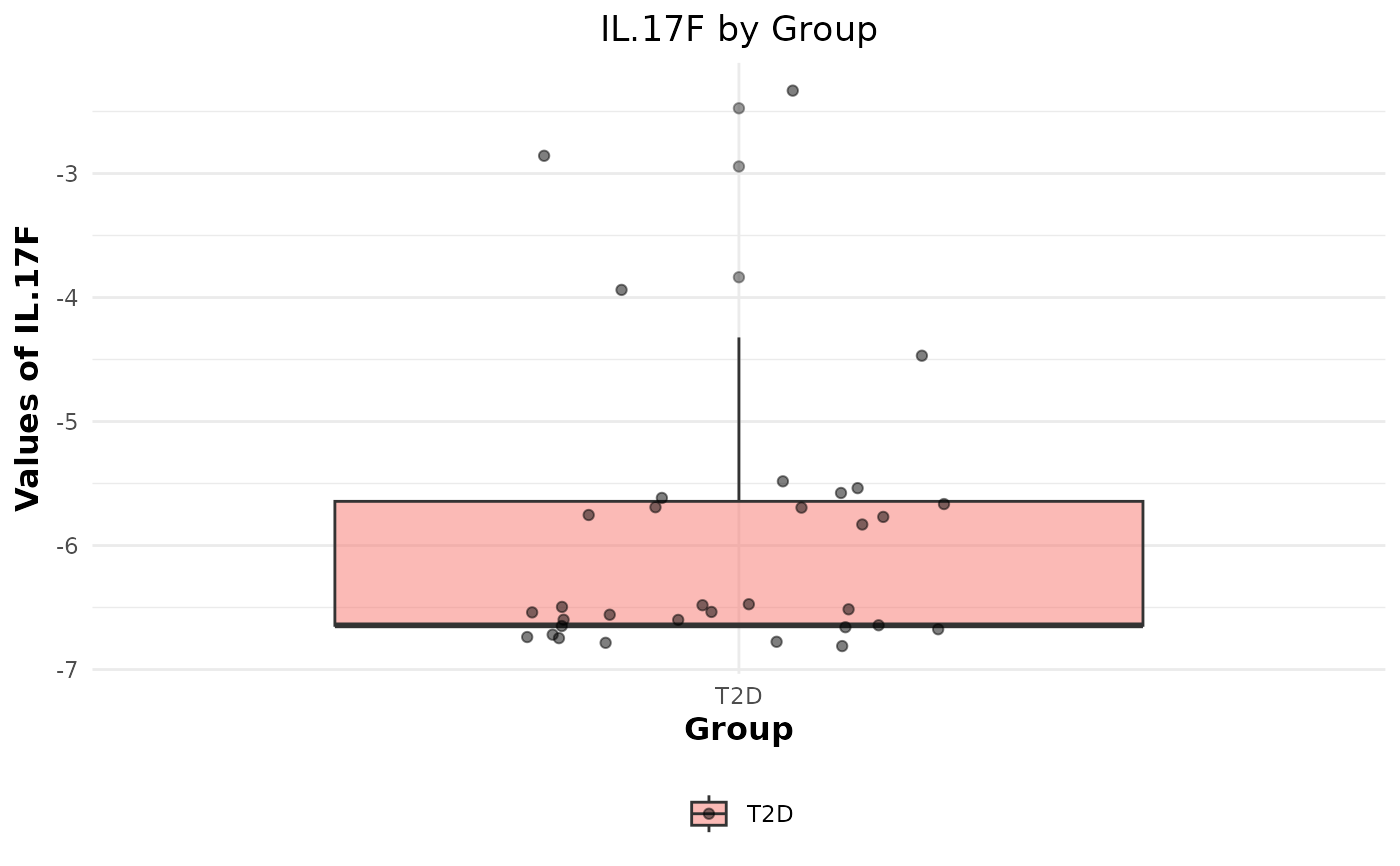
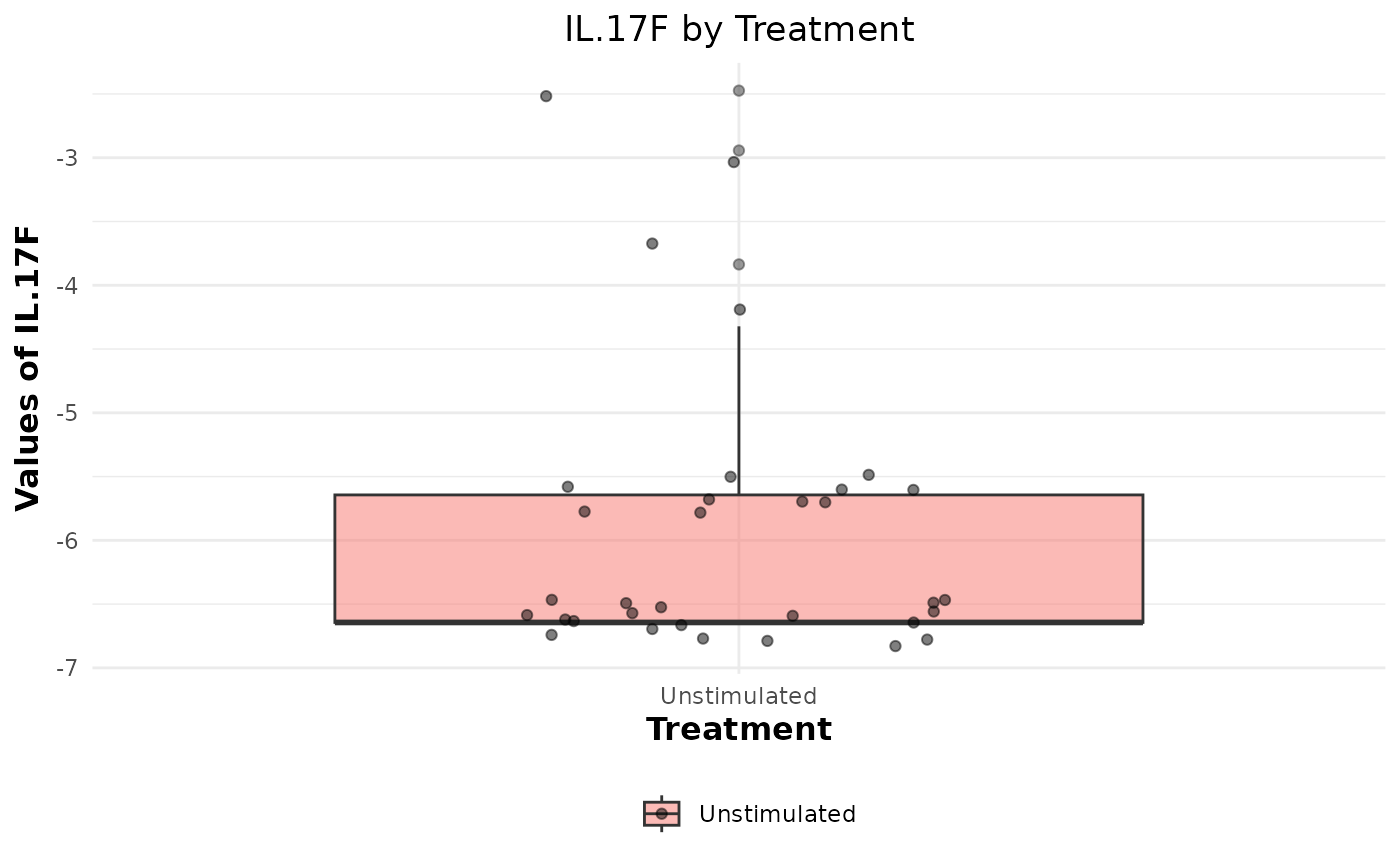
This function generates a PDF file containing boxplots for each combination of numeric and factor variables in the provided data. It first converts any character columns to factors and checks that the data contains at least one numeric and one factor column. If the scale argument is set to "log2", all numeric columns are log2-transformed. The function then creates boxplots using ggplot2 for each numeric variable grouped by each factor variable.
Arguments
- data
A matrix or data frame of raw data.
- pdf_title
A string representing the title (and filename) of the PDF file. If
NULL, the boxplots are displayed on the current graphics device. Defaults toNULL.- scale
Transformation option for continuous variables. Options are NULL (default) and "log2". When set to "log2", numeric columns are transformed using the log2 function.
- y_lim
An optional numeric vector defining the y-axis limits for the plots.