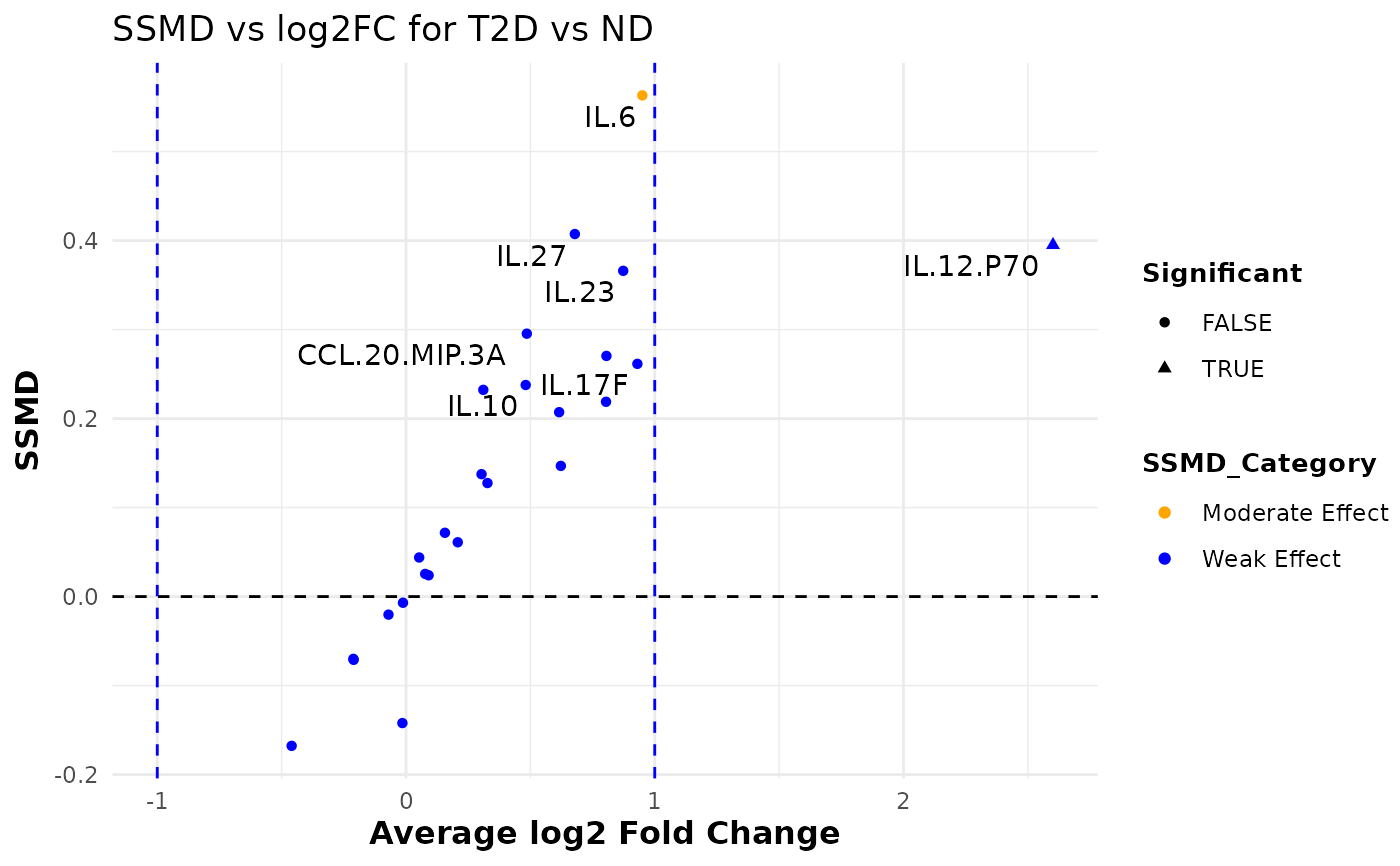
This function reshapes the input data and computes summary statistics (mean and variance) for each variable grouped by a specified factor column. It then calculates the SSMD (Strictly Standardized Mean Difference) and log2 fold change between two groups (group1 and group2) and categorizes the effect strength as "Strong Effect", "Moderate Effect", or "Weak Effect". A dual flash plot is generated using ggplot2 where the x-axis represents the average log2 fold change and the y-axis represents the SSMD. Additionally, the function prints the computed statistics to the console.
Usage
cyt_dualflashplot(
  data,
  group_var,
  group1,
  group2,
  ssmd_thresh = 1,
  log2fc_thresh = 1,
  top_labels = 15,
  verbose = FALSE
)
Arguments
- data
A data frame containing the input data.
- group_var
A string specifying the name of the grouping column in the data.
- group1
A string representing the name of the first group for comparison.
- group2
A string representing the name of the second group for comparison.
- ssmd_thresh
A numeric threshold for the SSMD value used to determine significance. Default is 1.
- log2fc_thresh
A numeric threshold for the log2 fold change used to determine significance. Default is 1.
- top_labels
An integer specifying the number of top variables (based on absolute SSMD) to label in the plot. Default is 15.
- verbose
A logical indicating whether to print the computed statistics to the console. Default is
FALSE.
Value
A ggplot object representing the dual flash plot for the comparisons between group1 and group2.
Examples
# Loading data
data_df <- ExampleData1[, -c(2:3)]

cyt_dualflashplot(
  data_df,
  group_var = "Group",
  group1 = "T2D",
  group2 = "ND",
  ssmd_thresh = -0.2,
  log2fc_thresh = 1,
  top_labels = 10,
  verbose = FALSE
)