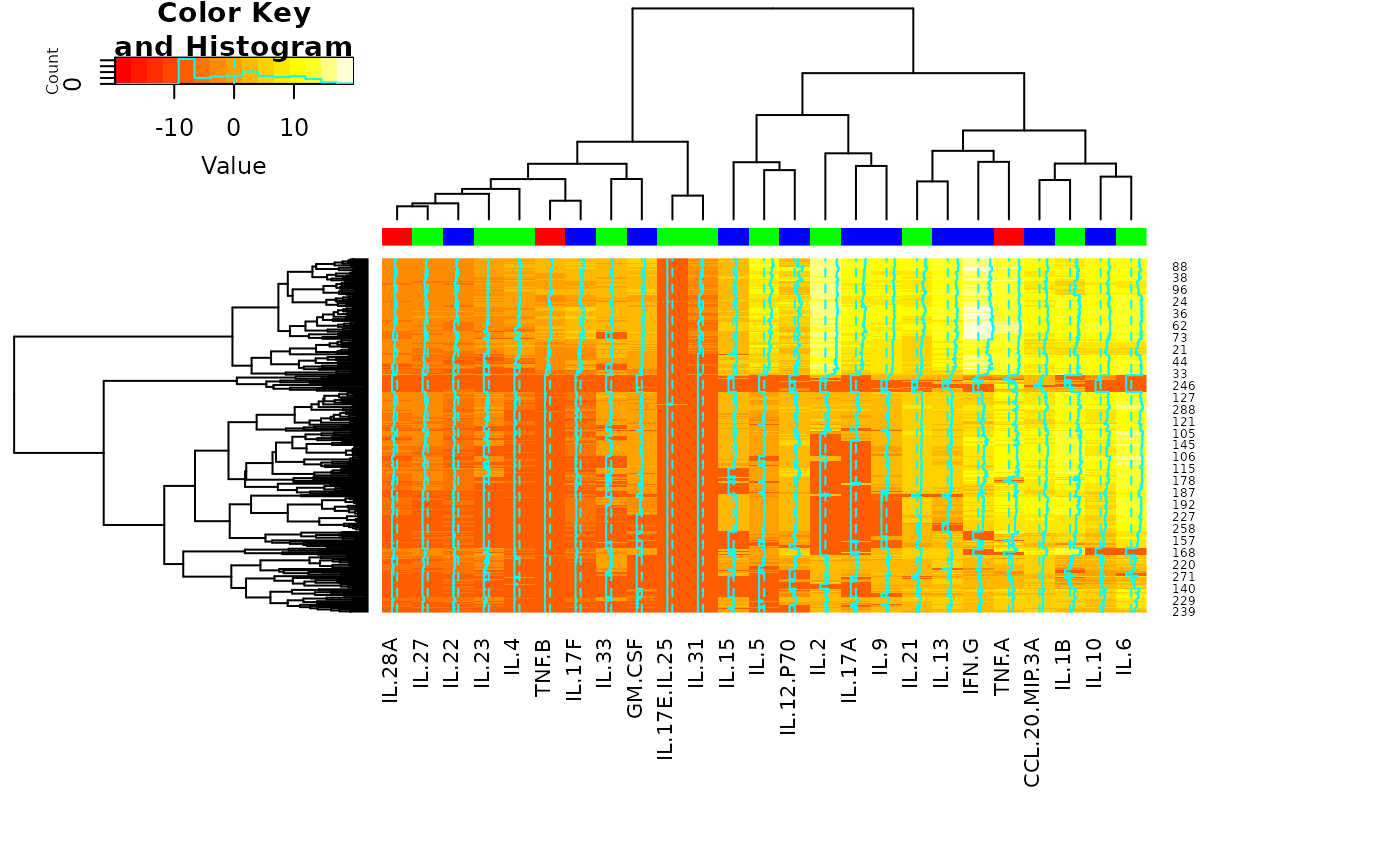
This function creates a heatmap using the numeric columns from the
provided data frame. If requested via the scale parameter,
the function applies a log2 transformation to the data (with non-positive
values replaced by NA). The heatmap is saved as a file,
with the format determined by the file extension in title.
Arguments
- data
A data frame containing the input data. Only numeric columns will be used to generate the heatmap.
- scale
Character. An optional scaling option. If set to "log2", the numeric data will be log2-transformed (with non-positive values set to NA). Default is NULL.
- annotation_col_name
Character. An optional column name from
datato be used for generating annotation colors. Default is NULL.- title
Character. The title of the heatmap and the file name for saving the plot. The file extension (".pdf" or ".png") determines the output format. If
NULL, the plot is generated on the current graphics device. Default isNULL.
Examples
# Load sample data
data("ExampleData1")
data_df <- ExampleData1
# Generate a heatmap with log2 scaling and annotation based on
# the "Group" column
cyt_heatmap(
  data = data_df[, -c(2:3)],
  scale = "log2",  # Optional scaling
  annotation_col_name = "Group",
  title = NULL
)
#> Warning: Non-numeric columns detected. Subsetting to
#>             numeric columns only.