This function performs Principal Component Analysis (PCA) on cytokine data and generates several types of plots, including:
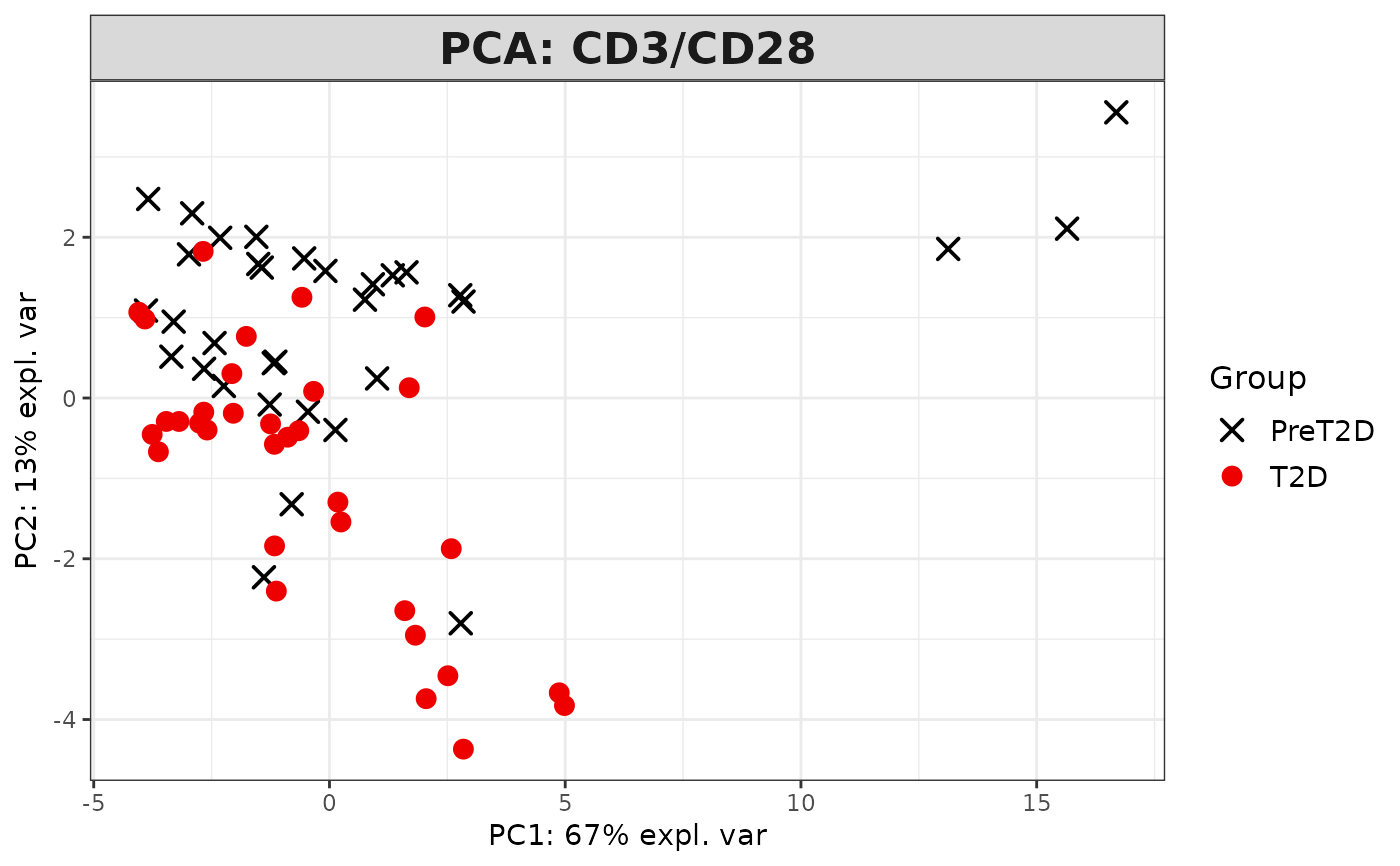
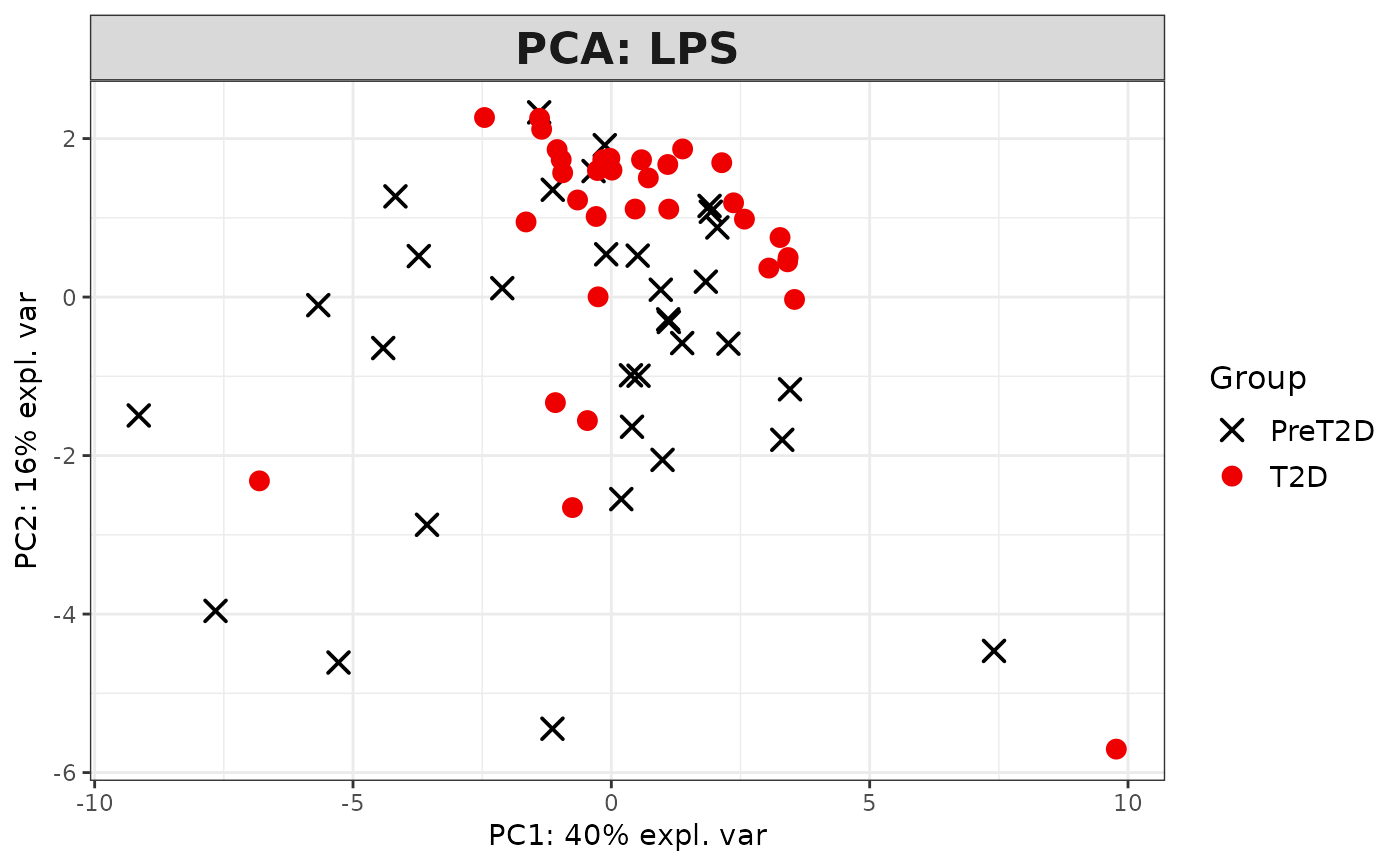
2D PCA plots using mixOmics'
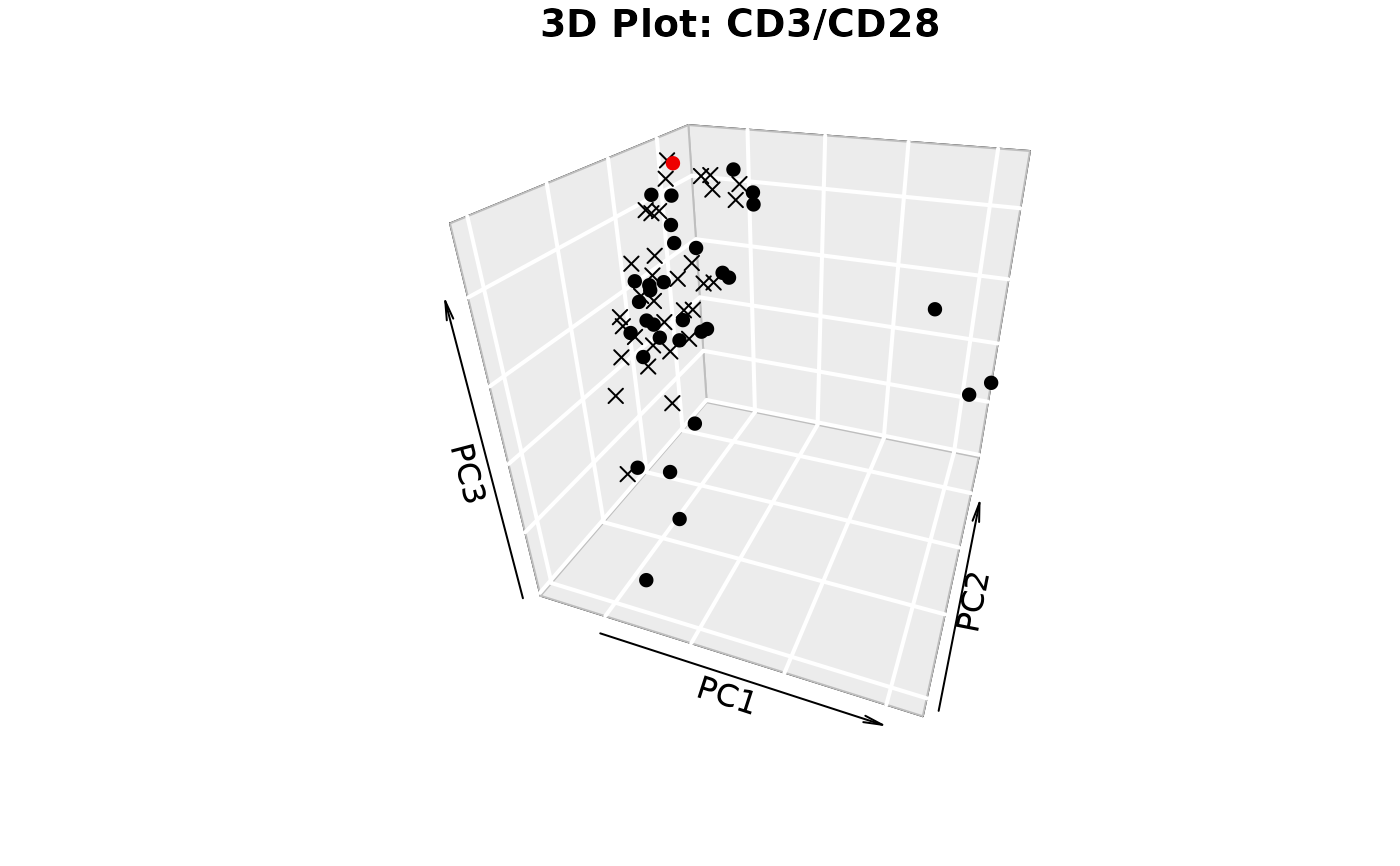
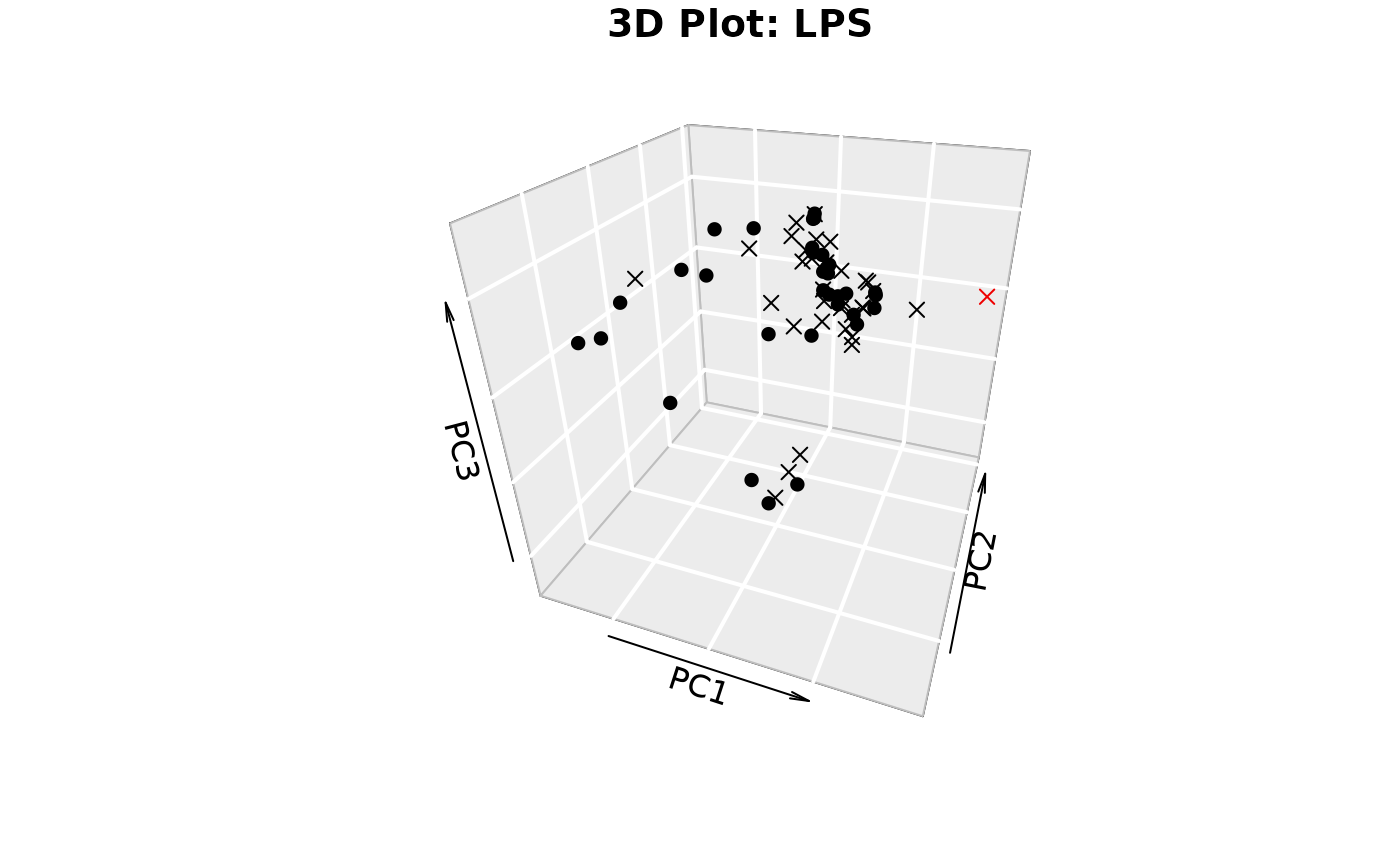
plotIndivfunction,3D scatter plots (if
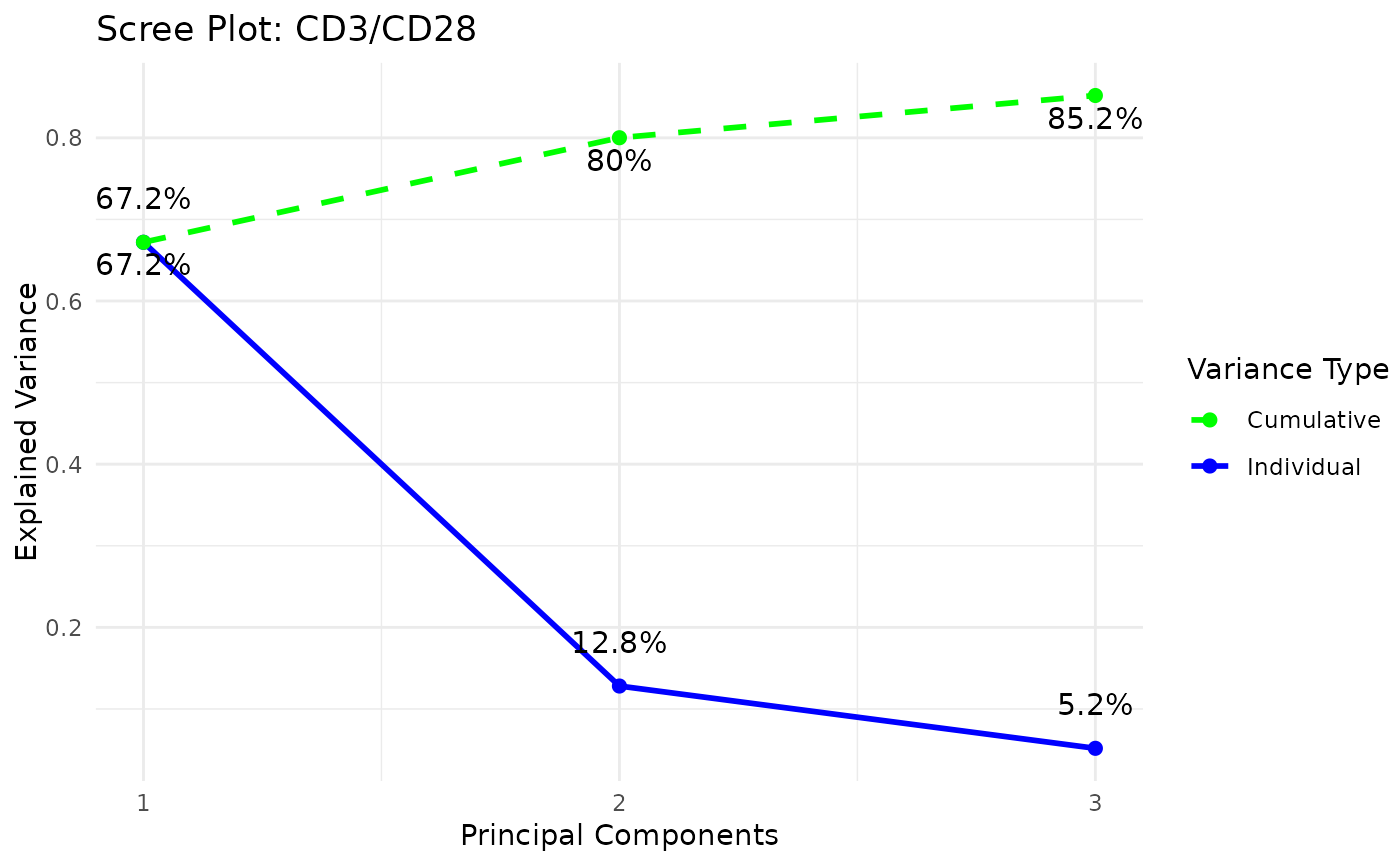
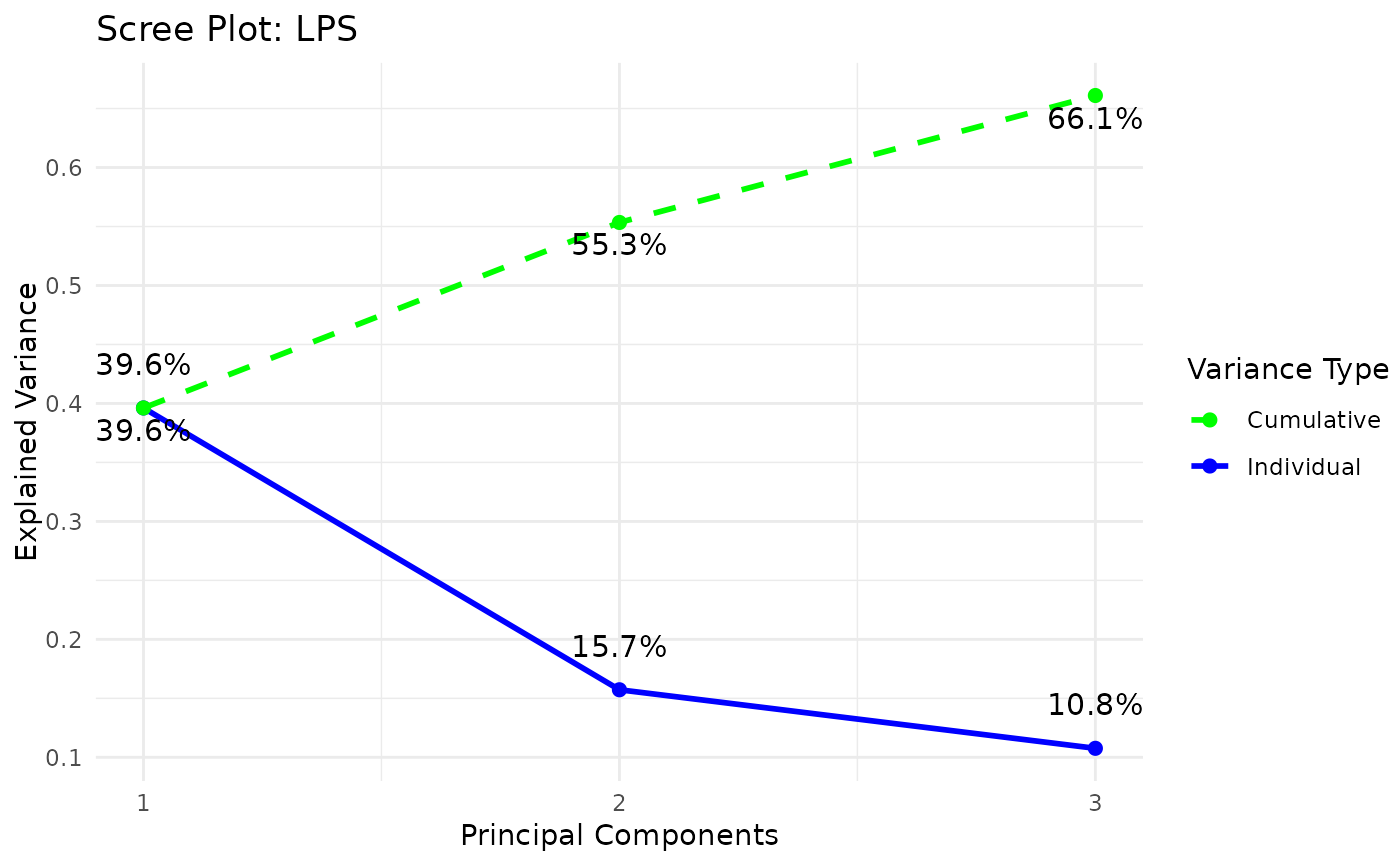
styleis "3d" or "3D" andcomp_numis 3) via the plot3D package,Scree plots showing both individual and cumulative explained variance,
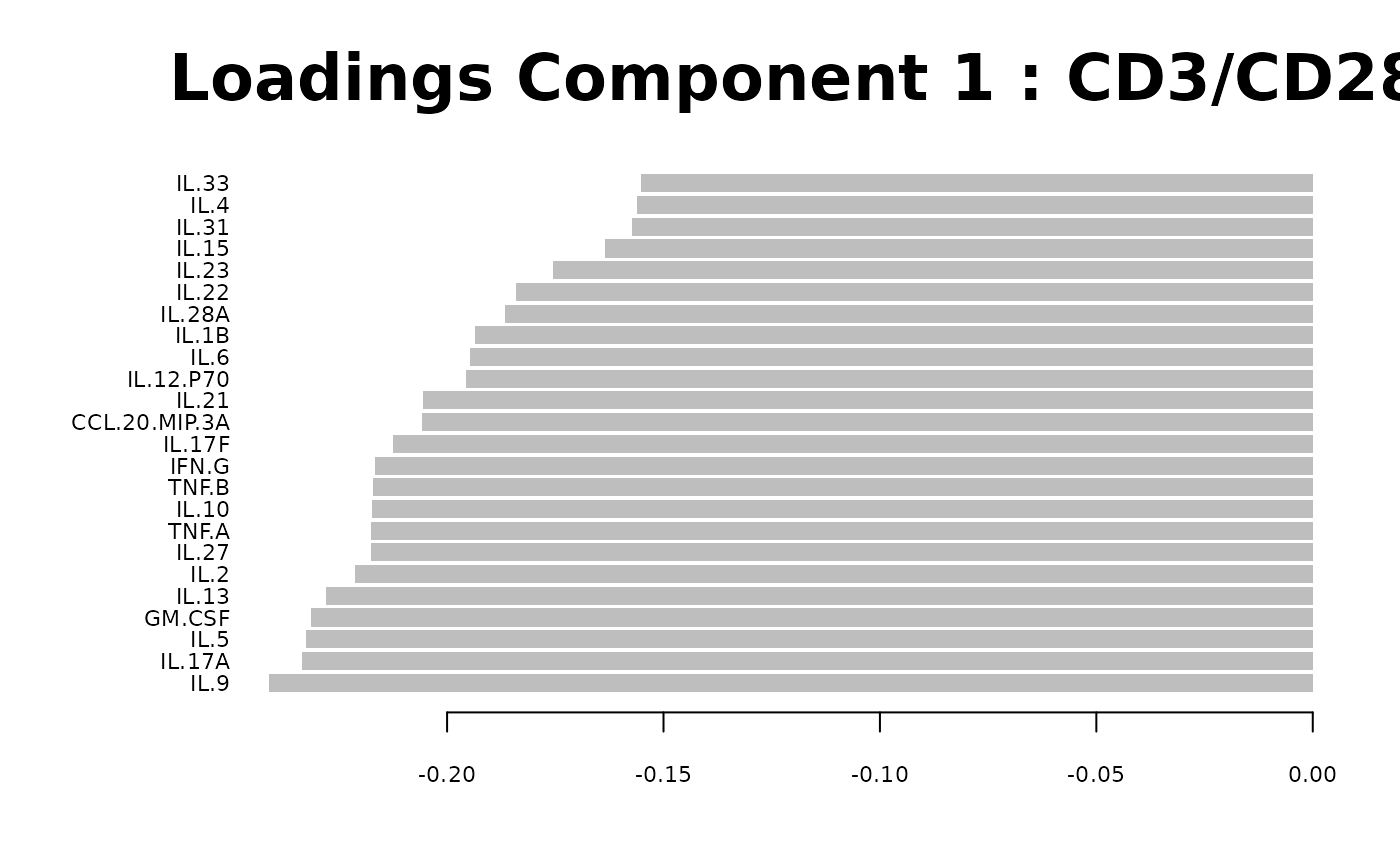
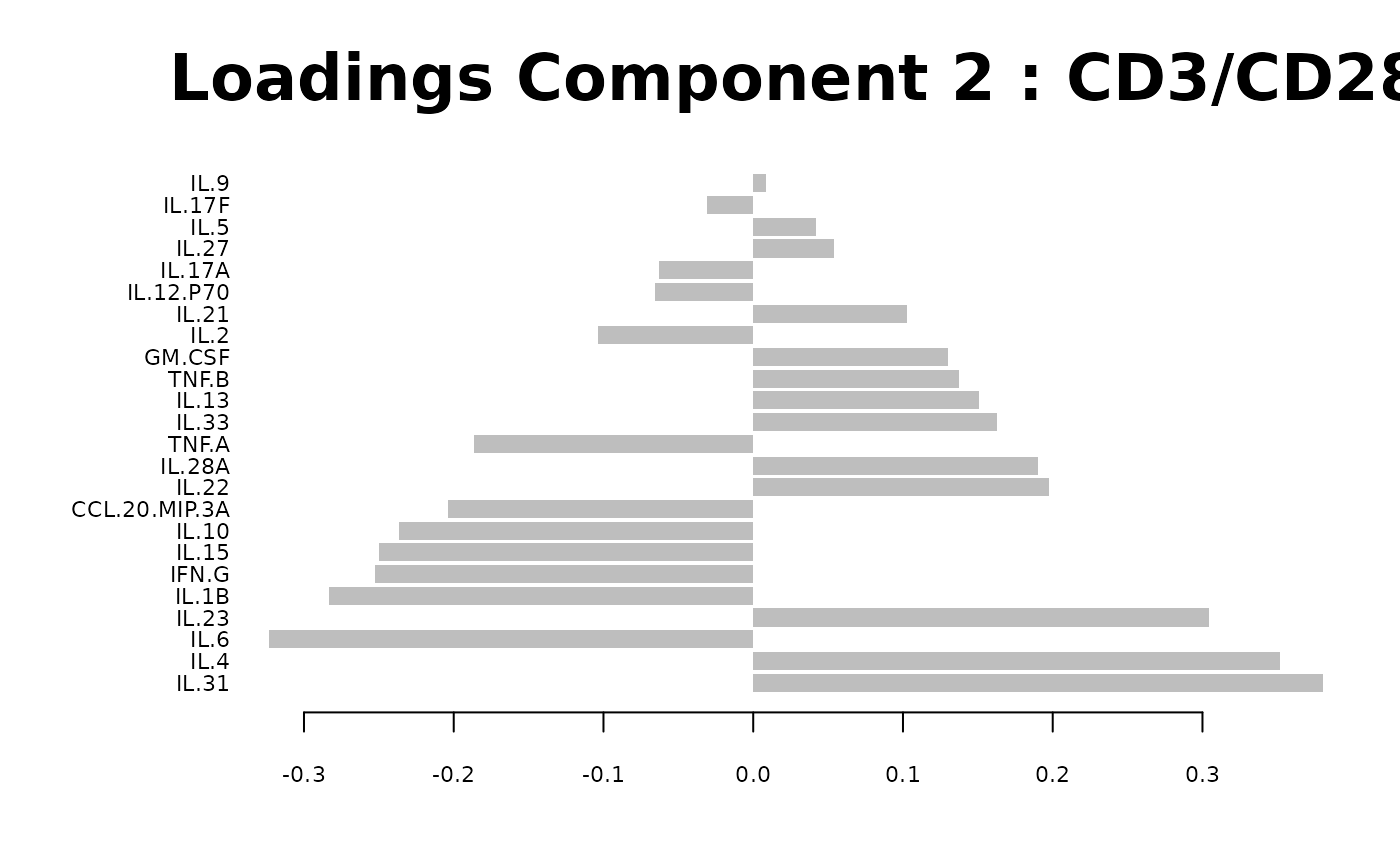
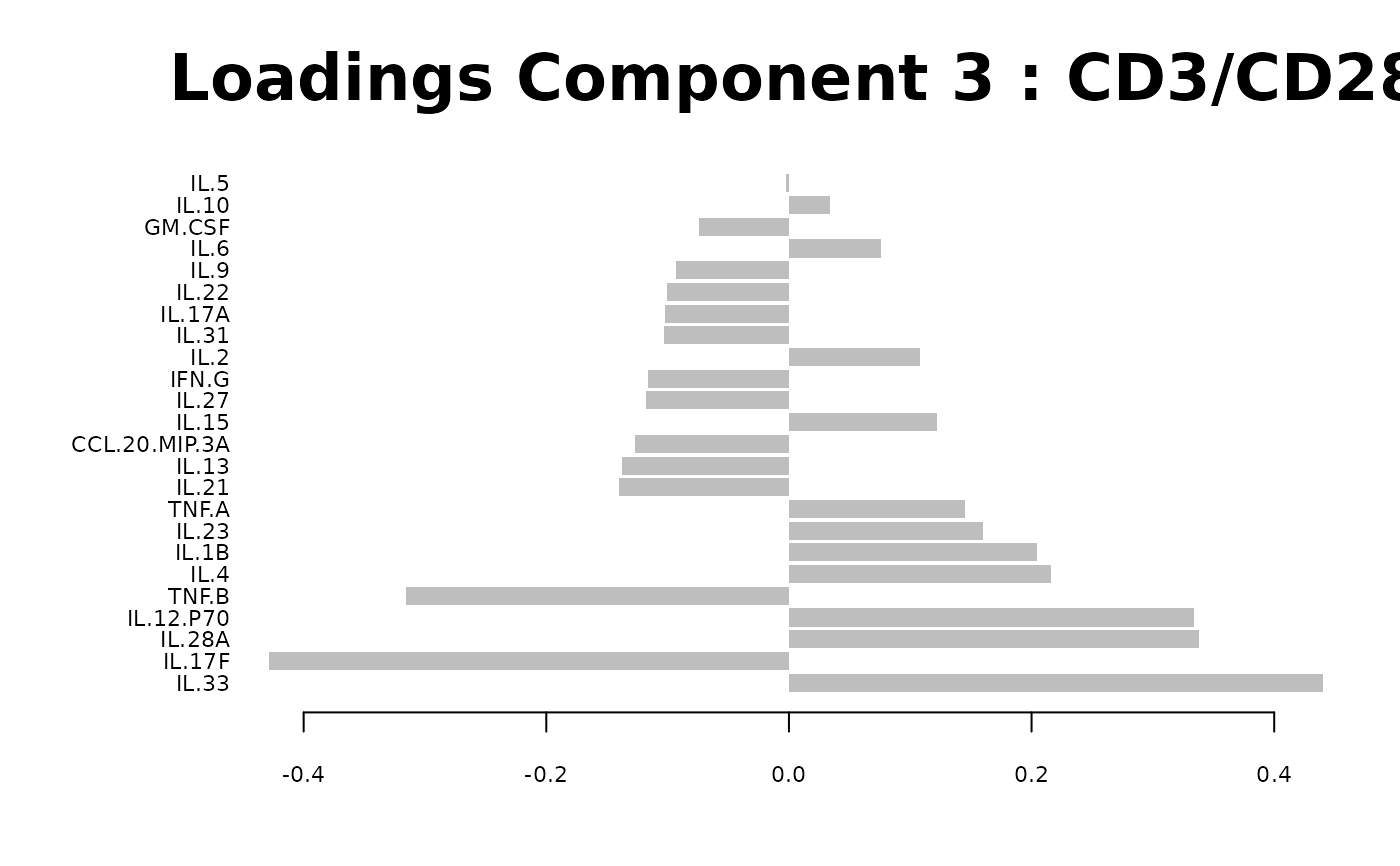
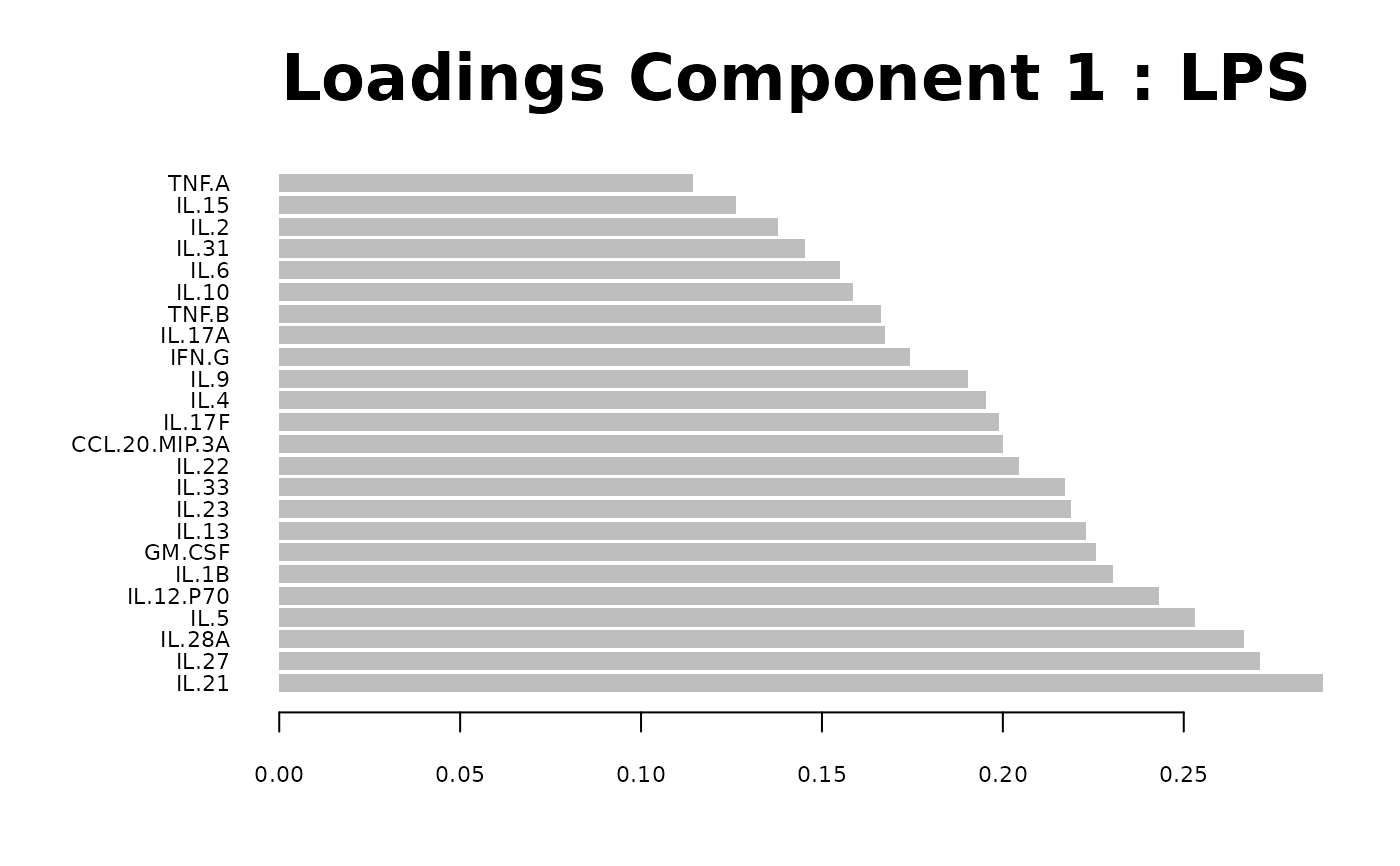
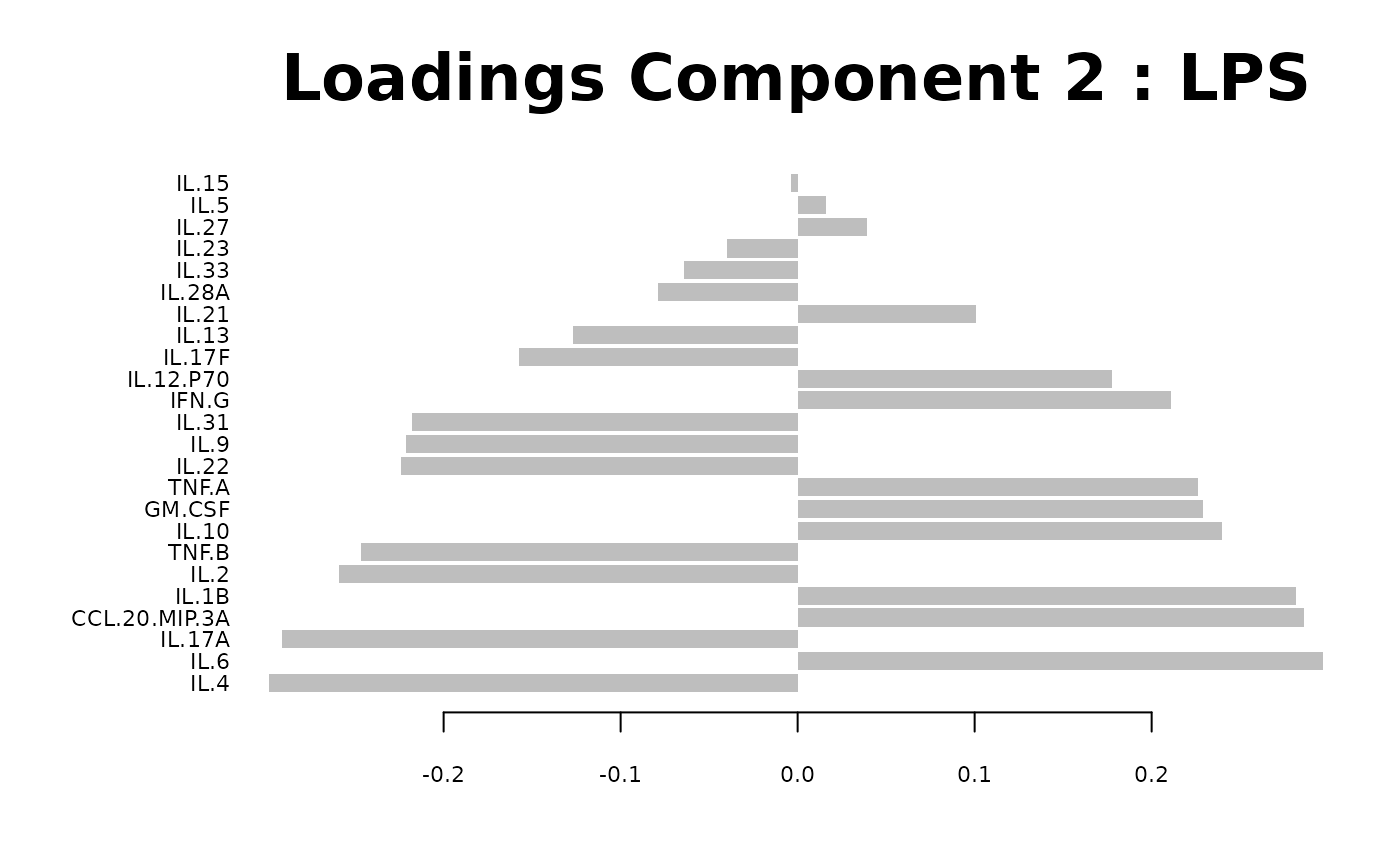
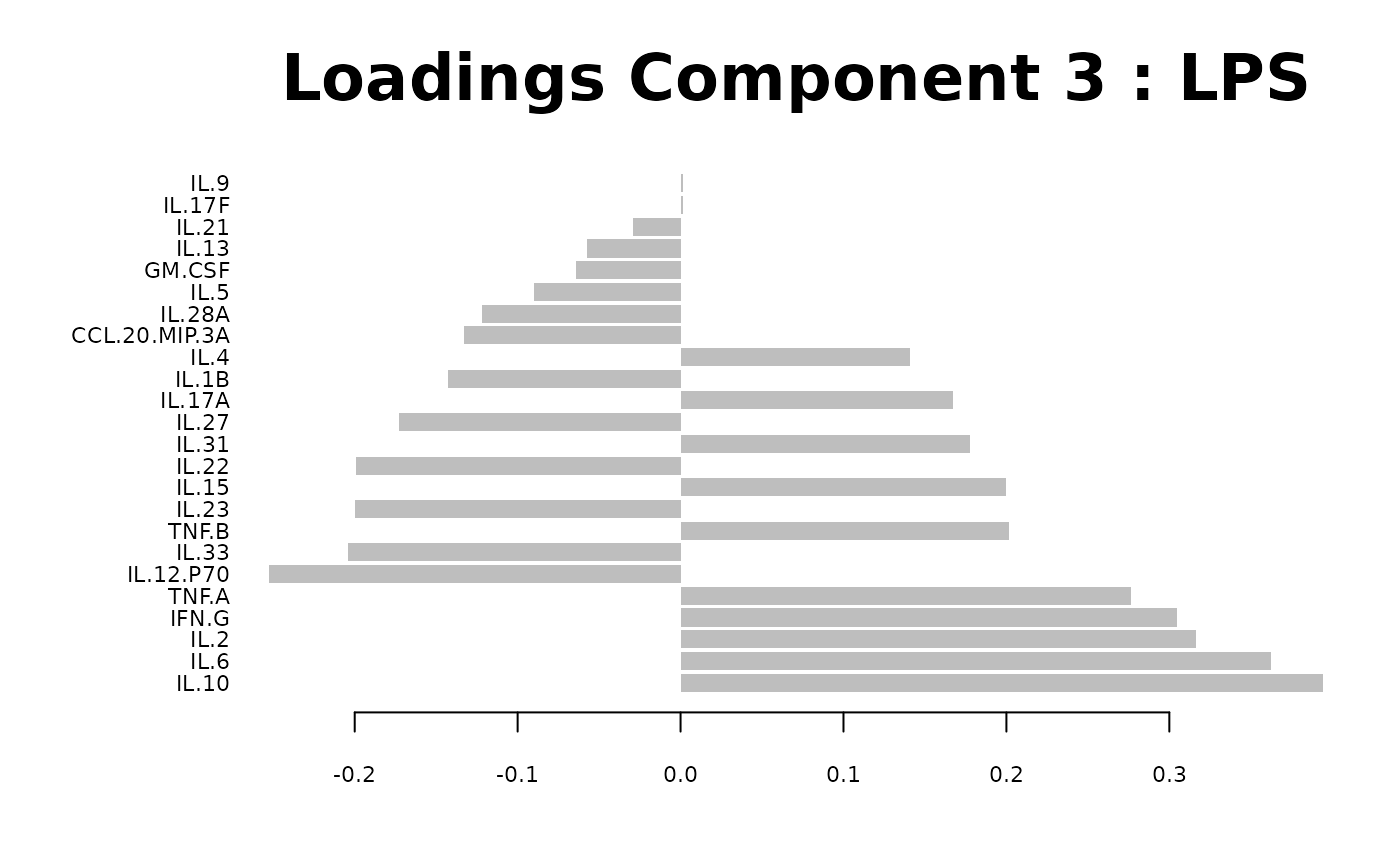
Loadings plots, and
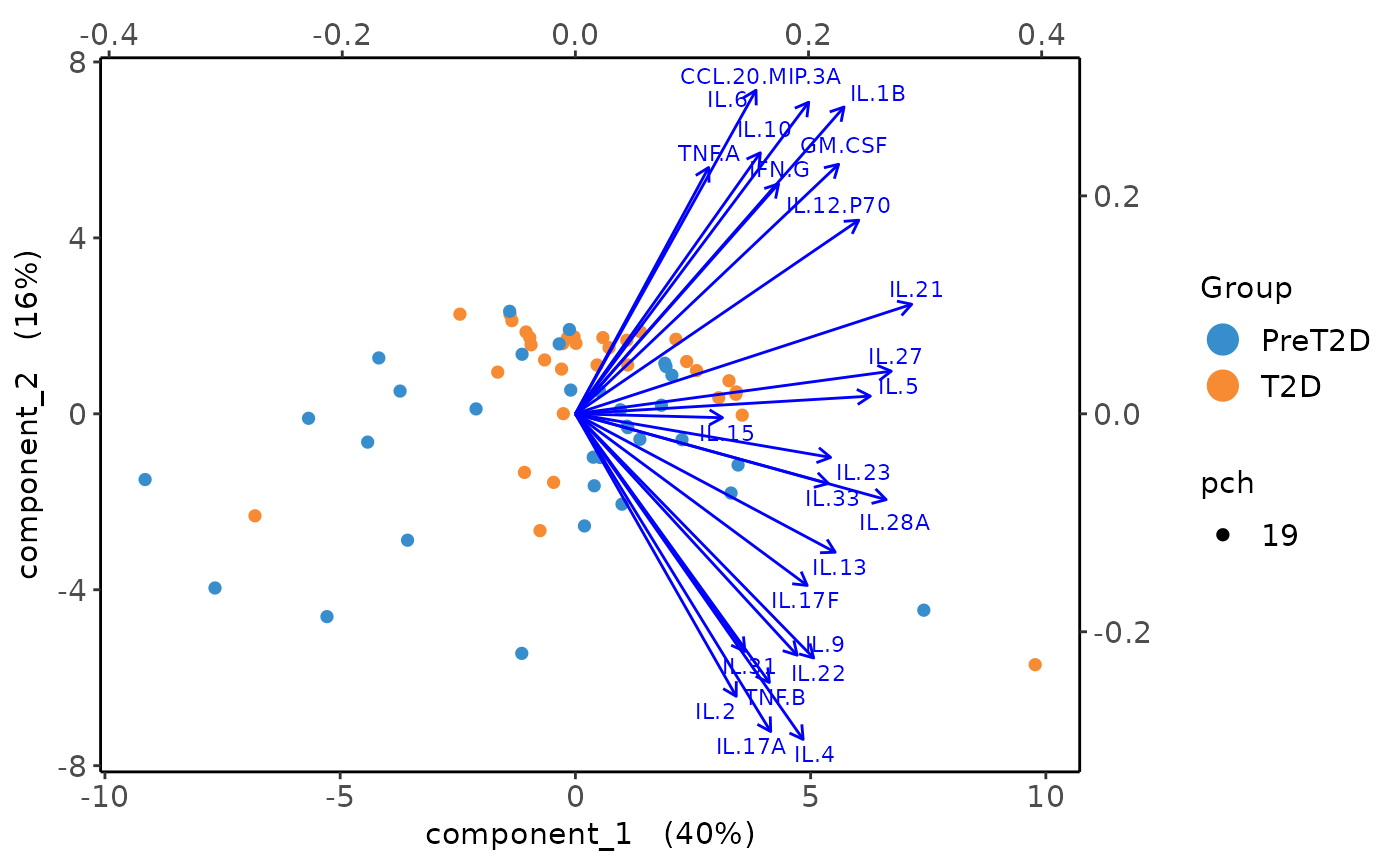
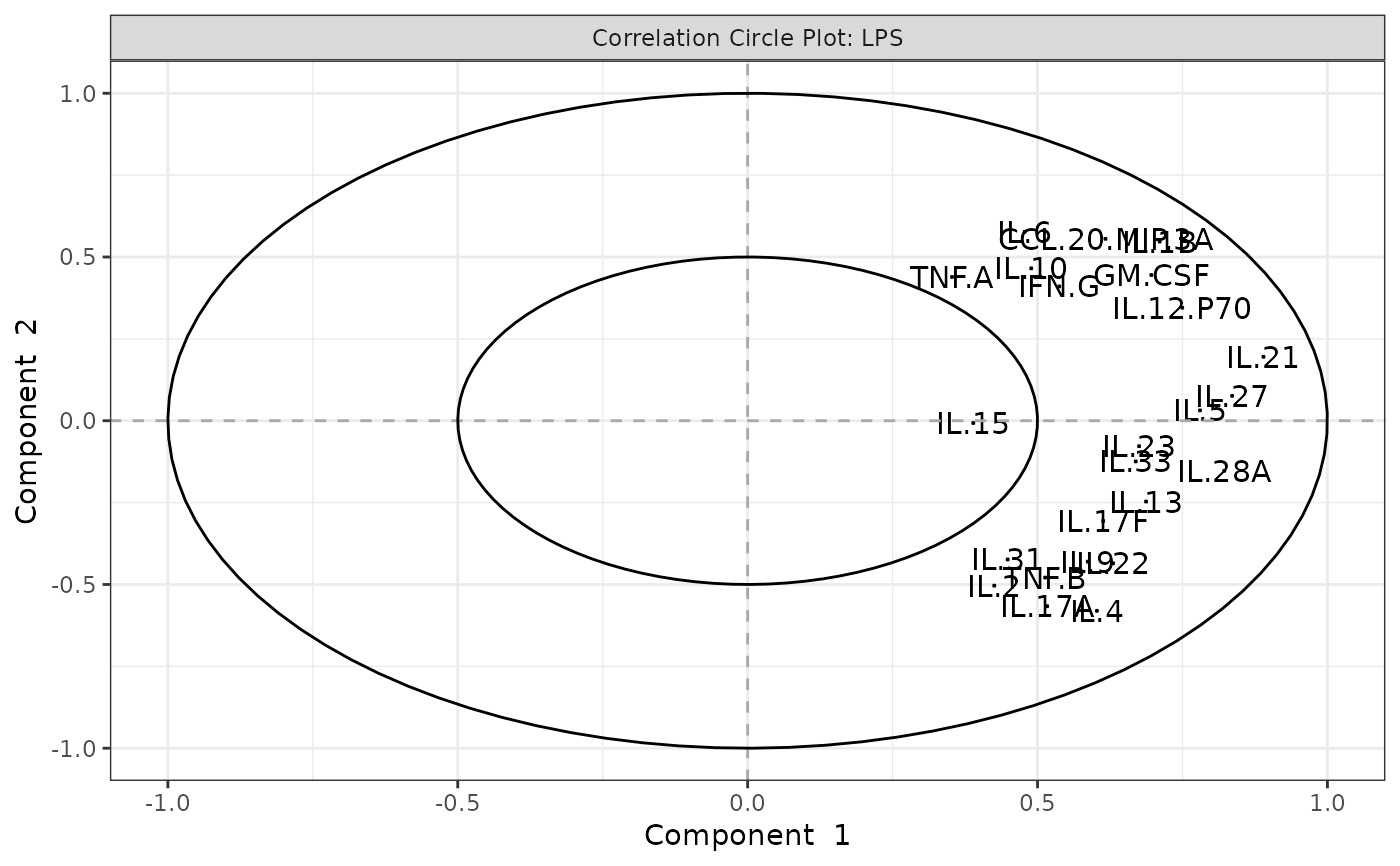
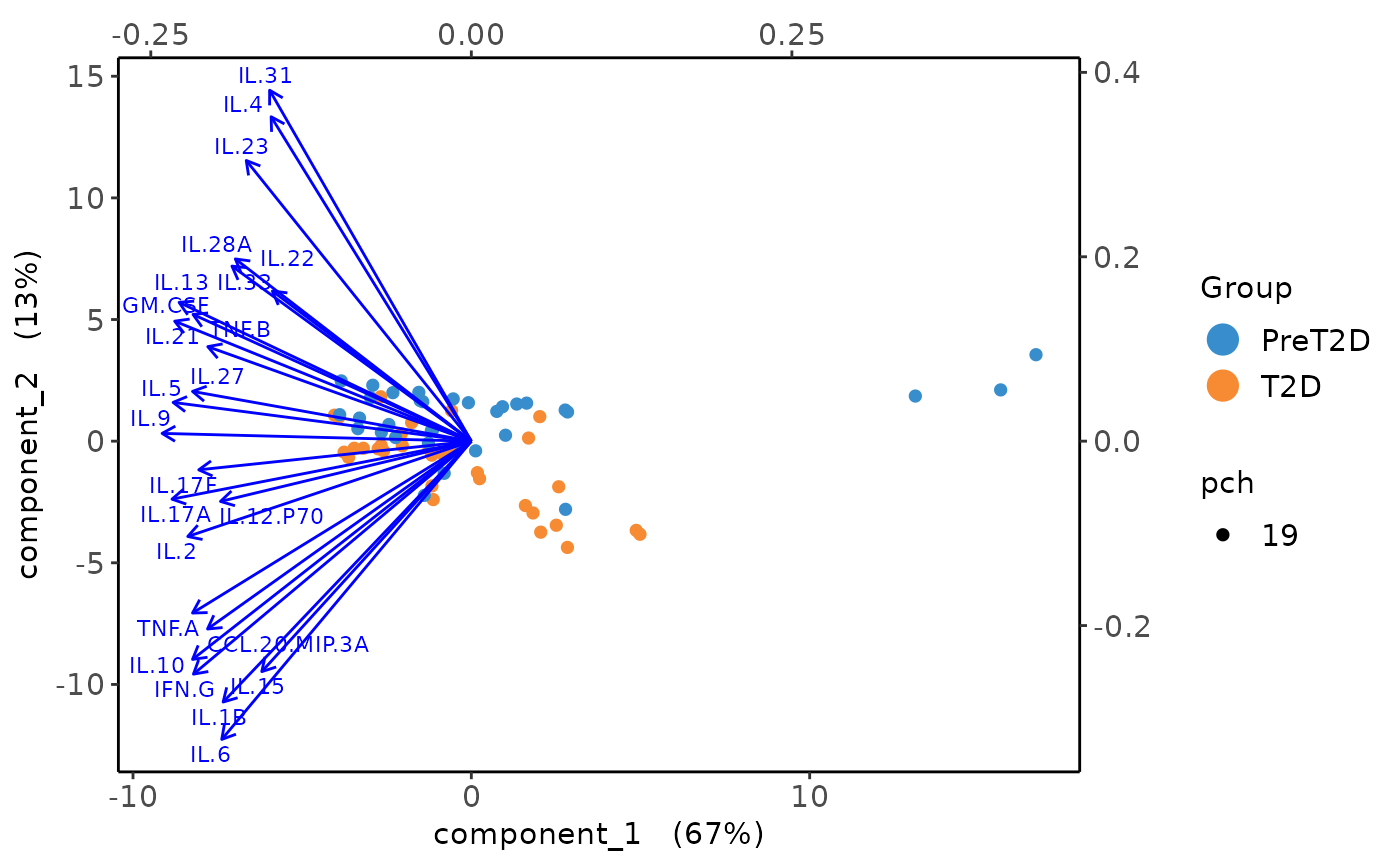
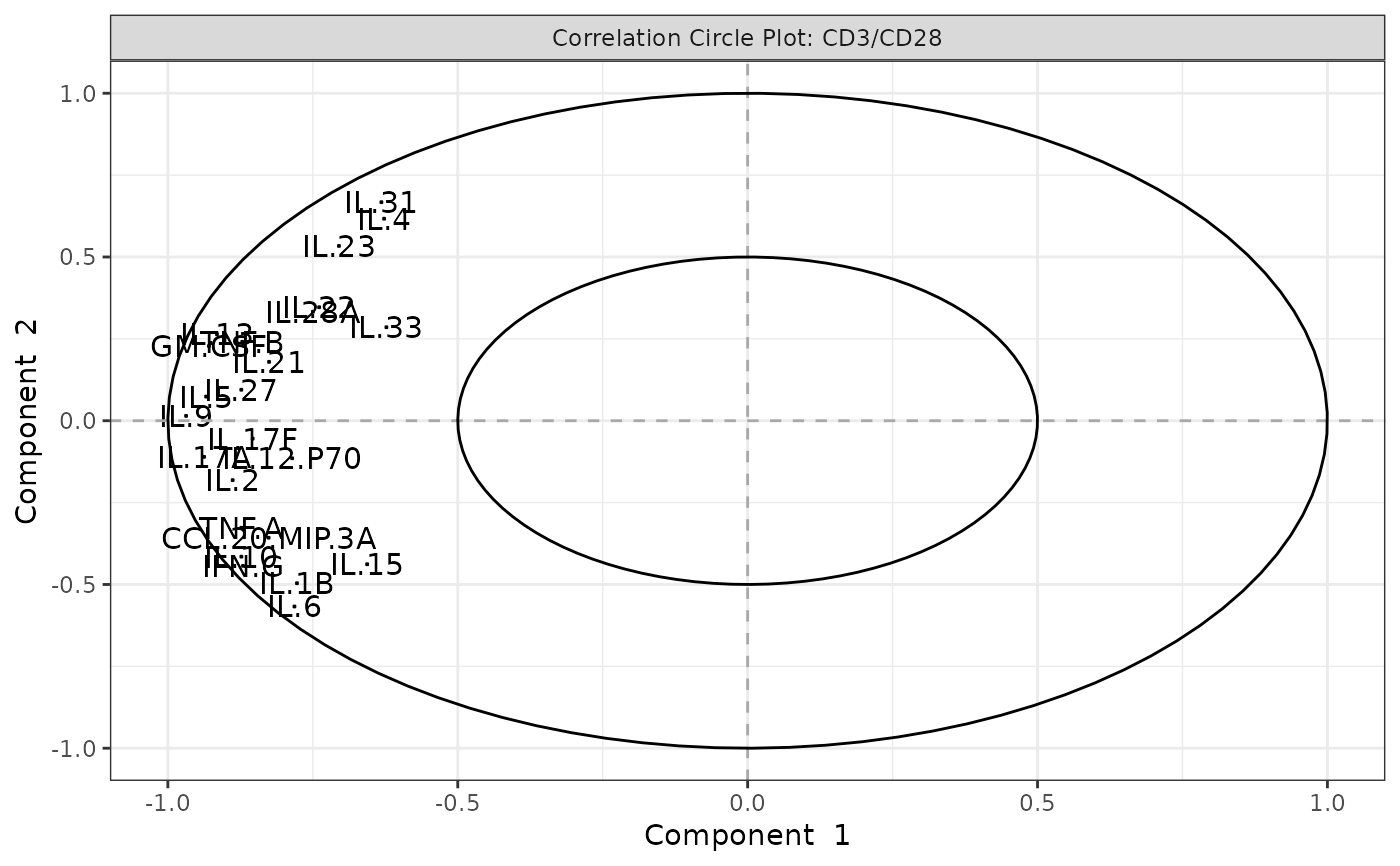
Biplots and correlation circle plots.
The function optionally applies a log2 transformation to the numeric data and handles analyses based treatment groups.
Usage
cyt_pca(
  data,
  group_col = NULL,
  group_col2 = NULL,
  colors = NULL,
  pdf_title,
  ellipse = FALSE,
  comp_num = 2,
  scale = NULL,
  pch_values = NULL,
  style = NULL
)
Arguments
- data
A data frame containing cytokine data. It should include at least one column representing grouping information and optionally a second column representing treatment or stimulation.
- group_col
A string specifying the column name that contains the first group information. If
group_col2is not provided, an overall analysis will be performed.- group_col2
A string specifying the second grouping column. Default is
NULL.- colors
A vector of colors corresponding to the groups. If set to NULL, a palette is generated using
rainbow()based on the number of unique groups.- pdf_title
A string specifying the file name of the PDF where the PCA plots will be saved. If
NULL, the plots are generated on the current graphics device. Default isNULL.- ellipse
Logical. If TRUE, a 95% confidence ellipse is drawn on the PCA individuals plot. Default is FALSE.
- comp_num
Numeric. The number of principal components to compute and display. Default is 2.
- scale
Character. If set to "log2", a log2 transformation is applied to the numeric cytokine measurements (excluding the grouping columns). Default is NULL.
- pch_values
A vector of plotting symbols (pch values) to be used in the PCA plots. Default is NULL.
- style
Character. If set to "3d" or "3D" and
comp_numequals 3, a 3D scatter plot is generated using the plot3D package. Default is NULL.
Examples
# Load sample data
data <- ExampleData1[, -c(3,23)]
data_df <- dplyr::filter(data, Group != "ND" & Treatment != "Unstimulated")
# Run PCA analysis and save plots to a PDF file
cyt_pca(
  data = data_df,
  pdf_title = NULL,
  colors = c("black", "red2"),
  scale = "log2",
  comp_num = 3,
  pch_values = c(16, 4),
  style = "3D",
  group_col = "Group",
  group_col2 = "Treatment",
  ellipse = FALSE
)
#> [1] "Results based on log2 transformation:"
#> Warning: 'pch.levels' is deprecated, please use 'pch' to specify point types


#> Warning: 'col.per.group' is deprecated, please use 'col' to specify colours for each group


#> Warning: 'pch.levels' is deprecated, please use 'pch' to specify point types


#> Warning: 'col.per.group' is deprecated, please use 'col' to specify colours for each group