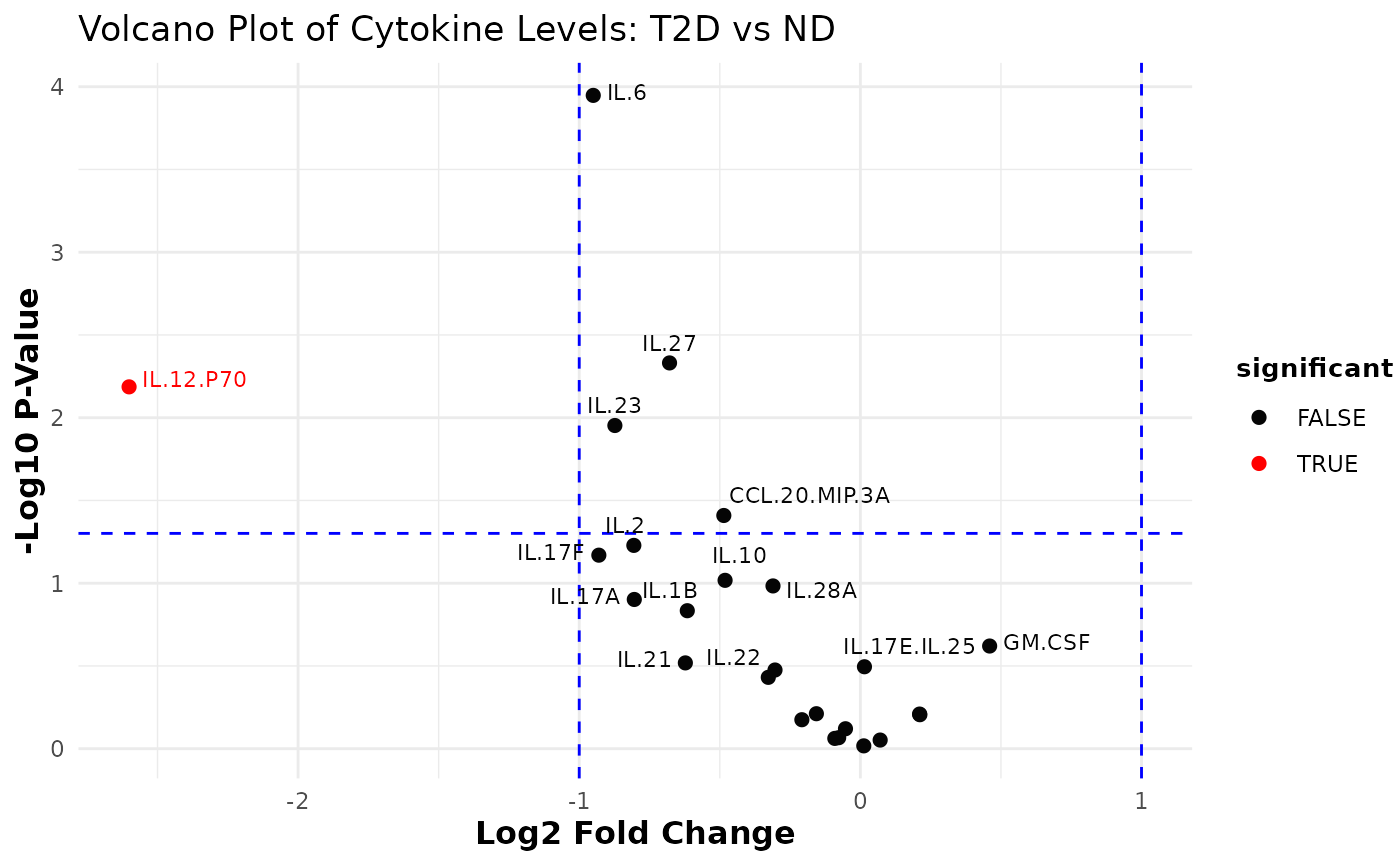
This function subsets the numeric columns from the input data and compares them based on a selected grouping column. It computes the fold changes (as the ratio of means) and associated p-values (using two-sample t-tests) for each numeric variable between two groups. The results are log2-transformed (for fold change) and -log10-transformed (for p-values) to generate a volcano plot.
Usage
cyt_volc(
  data,
  group_col,
  cond1 = NULL,
  cond2 = NULL,
  fold_change_thresh = 2,
  p_value_thresh = 0.05,
  top_labels = 10,
  verbose = FALSE
)
Arguments
- data
A matrix or data frame containing the data to be analyzed.
- group_col
A character string specifying the column name used for comparisons (e.g., group, treatment, or stimulation).
- cond1
A character string specifying the name of the first condition for comparison. Default is
NULL.- cond2
A character string specifying the name of the second condition for comparison. Default is
NULL.- fold_change_thresh
A numeric threshold for the fold change. Default is
2.- p_value_thresh
A numeric threshold for the p-value. Default is
0.05.- top_labels
An integer specifying the number of top variables to label on the plot. Default is
10.- verbose
A logical indicating whether to print the computed statistics to the console. Default is
FALSE.
Value
A list of volcano plots (as ggplot objects) for each pairwise
comparison. Additionally, the function prints the data frame used for
plotting (excluding the significance column) from the final comparison.