This function trains and evaluates an XGBoost classification model on cytokine data. It allows for hyperparameter tuning, cross-validation, and visualizes feature importance.
Usage
cyt_xgb(
  data,
  group_col,
  train_fraction = 0.7,
  nrounds = 500,
  max_depth = 6,
  eta = 0.1,
  nfold = 5,
  cv = FALSE,
  objective = "multi:softprob",
  early_stopping_rounds = NULL,
  eval_metric = "mlogloss",
  gamma = 0,
  colsample_bytree = 1,
  subsample = 1,
  min_child_weight = 1,
  top_n_features = 10,
  verbose = 1,
  plot_roc = FALSE,
  print_results = FALSE,
  seed = 123
)
Arguments
- data
A data frame containing the cytokine data, with one column as the grouping variable and the rest as numerical features.
- group_col
A string representing the name of the column with the grouping variable (i.e., the target variable for classification).
- train_fraction
A numeric value between 0 and 1 representing the proportion of data to use for training (default is 0.7).
- nrounds
An integer specifying the number of boosting rounds (default is 500).
- max_depth
An integer specifying the maximum depth of the trees (default is 6).
- eta
A numeric value representing the learning rate (default is 0.1).
- nfold
An integer specifying the number of folds for cross-validation (default is 5).
- cv
A logical value indicating whether to perform cross-validation (default is FALSE).
- objective
A string specifying the XGBoost objective function (default is "multi:softprob" for multi-class classification).
- early_stopping_rounds
An integer specifying the number of rounds with no improvement to stop training early (default is NULL).
- eval_metric
A string specifying the evaluation metric (default is "mlogloss").
- gamma
A numeric value for the minimum loss reduction required to make a further partition (default is 0).
- colsample_bytree
A numeric value specifying the subsample ratio of columns when constructing each tree (default is 1).
- subsample
A numeric value specifying the subsample ratio of the training instances (default is 1).
- min_child_weight
A numeric value specifying the minimum sum of instance weight needed in a child (default is 1).
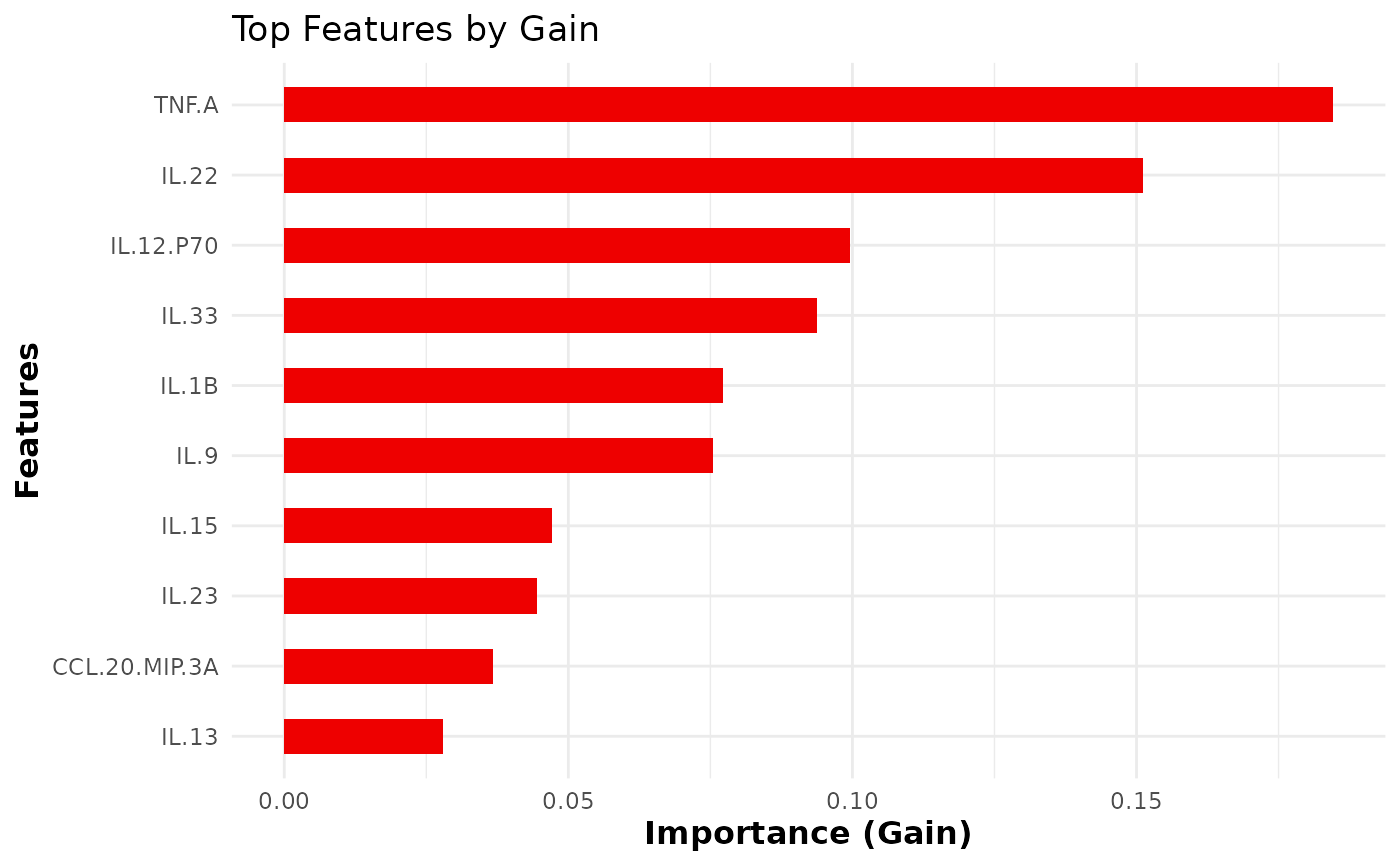
- top_n_features
An integer specifying the number of top features to display in the importance plot (default is 10).
- verbose
An integer specifying the verbosity of the training process (default is 1).
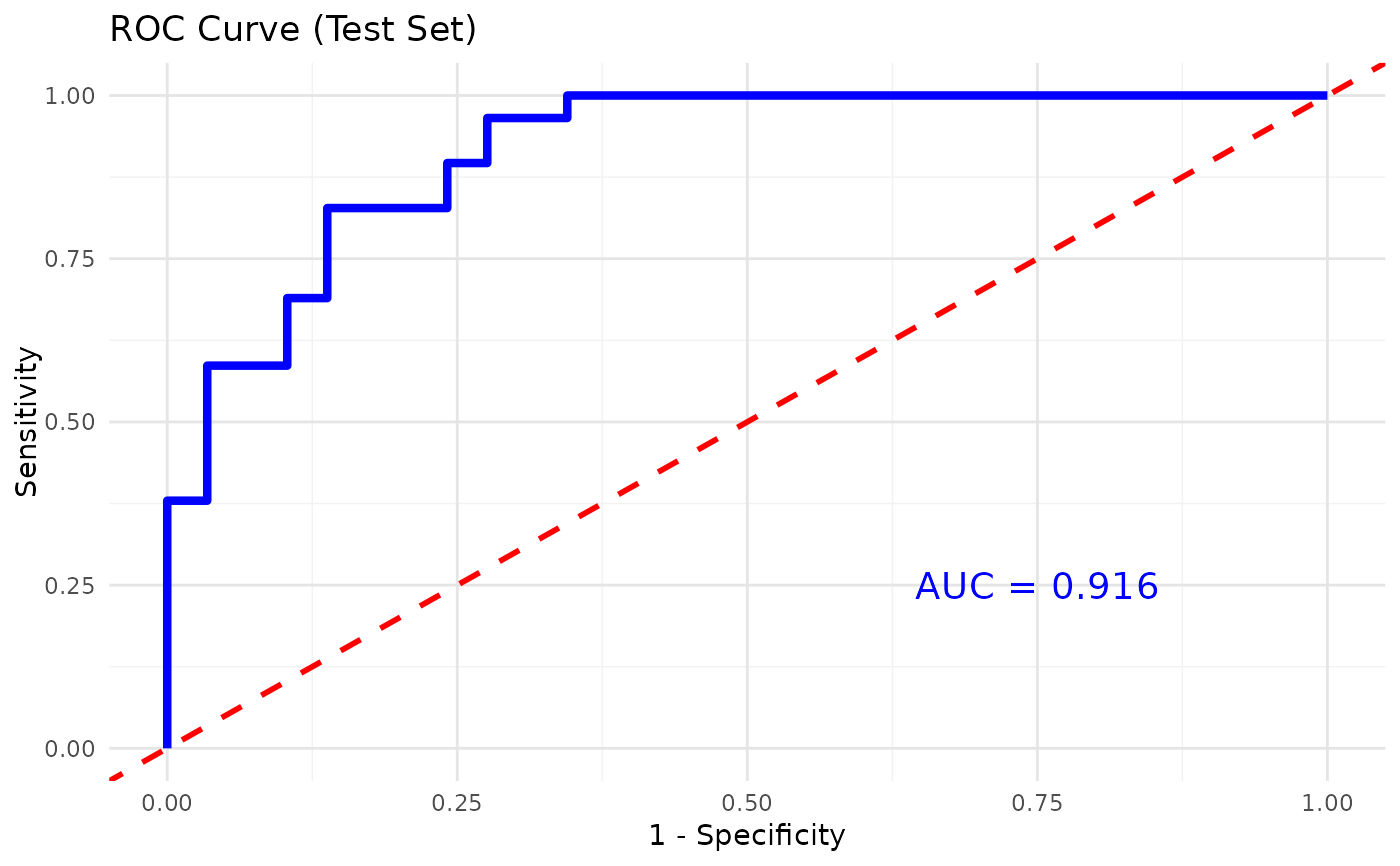
- plot_roc
A logical value indicating whether to plot the ROC curve and calculate the AUC for binary classification (default is
FALSE).- print_results
A logical value indicating whether to print the results of the model training and evaluation (default is
FALSE). If set toTRUE, it will print the confusion matrix, and feature importance.- seed
An integer specifying the seed for reproducibility (default is 123).
Value
A list containing:
- model
The trained XGBoost model.
- confusion_matrix
The confusion matrix of the test set predictions.
- importance
The feature importance matrix for the top features.
- class_mapping
A named vector showing the mapping from class labels to numeric values used for training.
- cv_results
Cross-validation results, if cross-validation was performed (otherwise NULL).
- plot
A ggplot object showing the feature importance plot.
Details
The function allows for training an XGBoost model on cytokine data,
splitting the data into training and test sets. If cross-validation is
enabled (cv = TRUE), it performs k-fold cross-validation and prints the
best iteration based on the evaluation metric.
The function also visualizes the top N important
features using xgb.ggplot.importance().
Examples
# Example usage:
data_df0 <- ExampleData1
data_df <- data.frame(data_df0[, 1:3], log2(data_df0[, -c(1:3)]))
data_df <- data_df[, -c(2,3)]
data_df <- dplyr::filter(data_df, Group != "ND")

cyt_xgb(
  data = data_df, group_col = "Group",
  nrounds = 500, max_depth = 4, eta = 0.05,
  nfold = 5, cv = FALSE, eval_metric = "mlogloss",
  early_stopping_rounds = NULL, top_n_features = 10,
  verbose = 0, plot_roc = TRUE, print_results = FALSE
)

#> Warning: A shallow copy of this data.table was taken so that := can add or remove 1 columns by reference. At an earlier point, this data.table was copied by R (or was created manually using structure() or similar). Avoid names<- and attr<- which in R currently (and oddly) may copy the whole data.table. Use set* syntax instead to avoid copying: ?set, ?setnames and ?setattr. It's also not unusual for data.table-agnostic packages to produce tables affected by this issue. If this message doesn't help, please report your use case to the data.table issue tracker so the root cause can be fixed or this message improved.